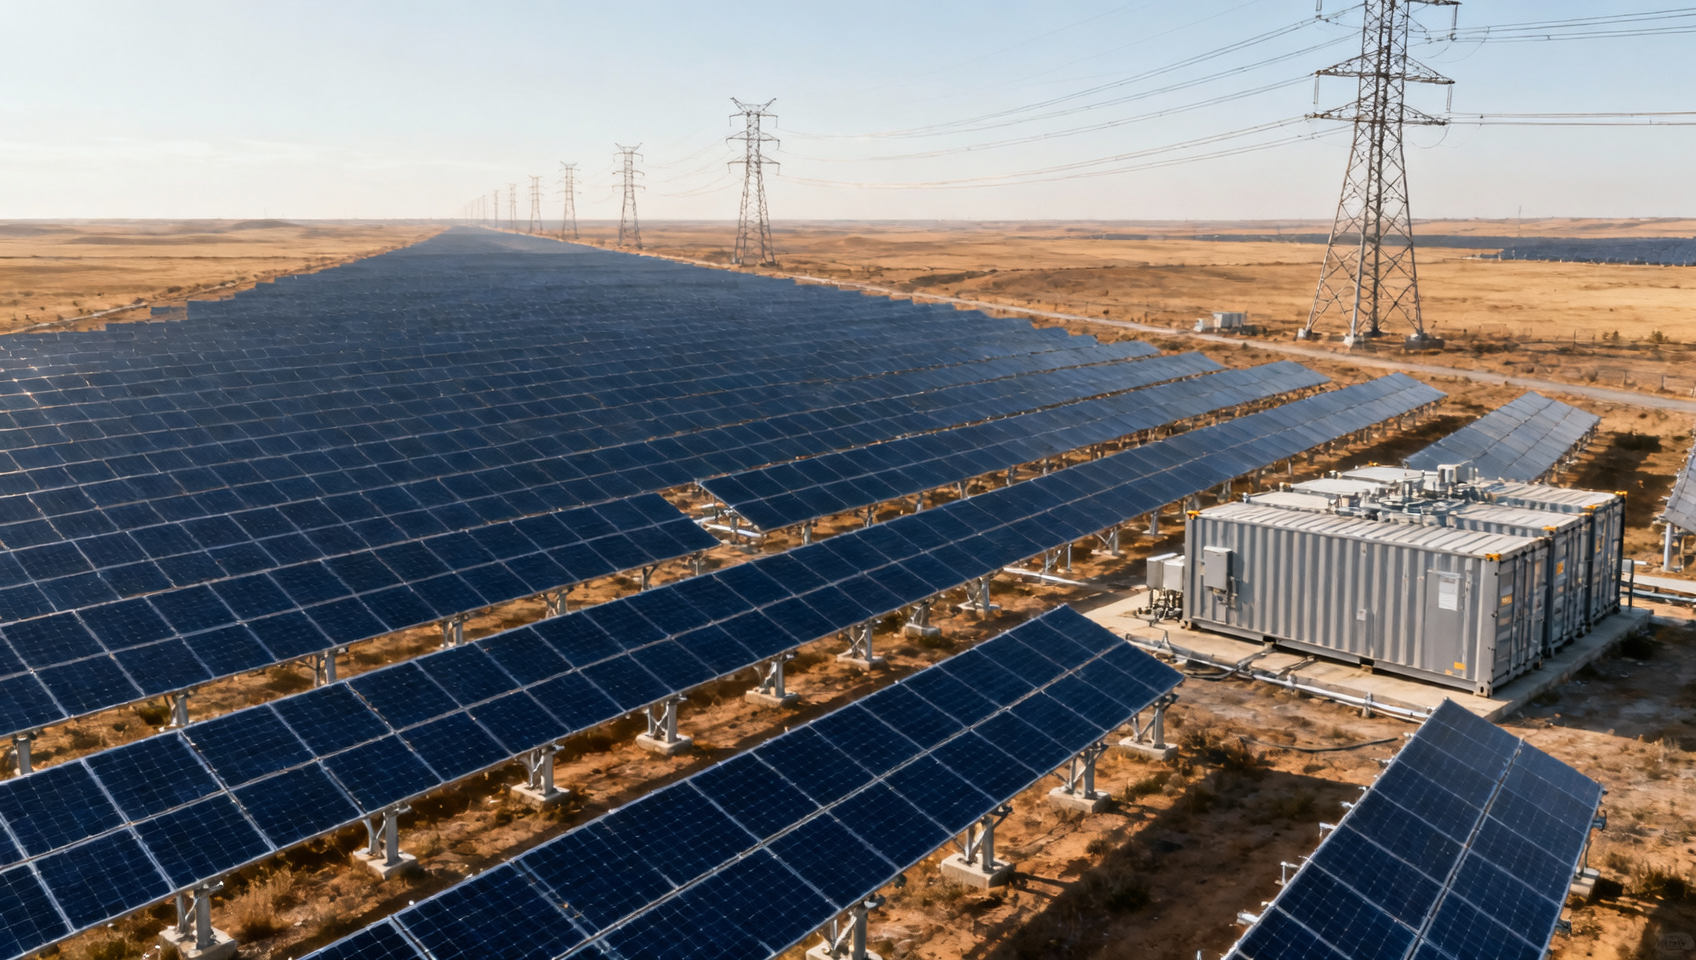
India Adds Record 8.4 GW of Open-Access Solar in First Nine Months of 2026
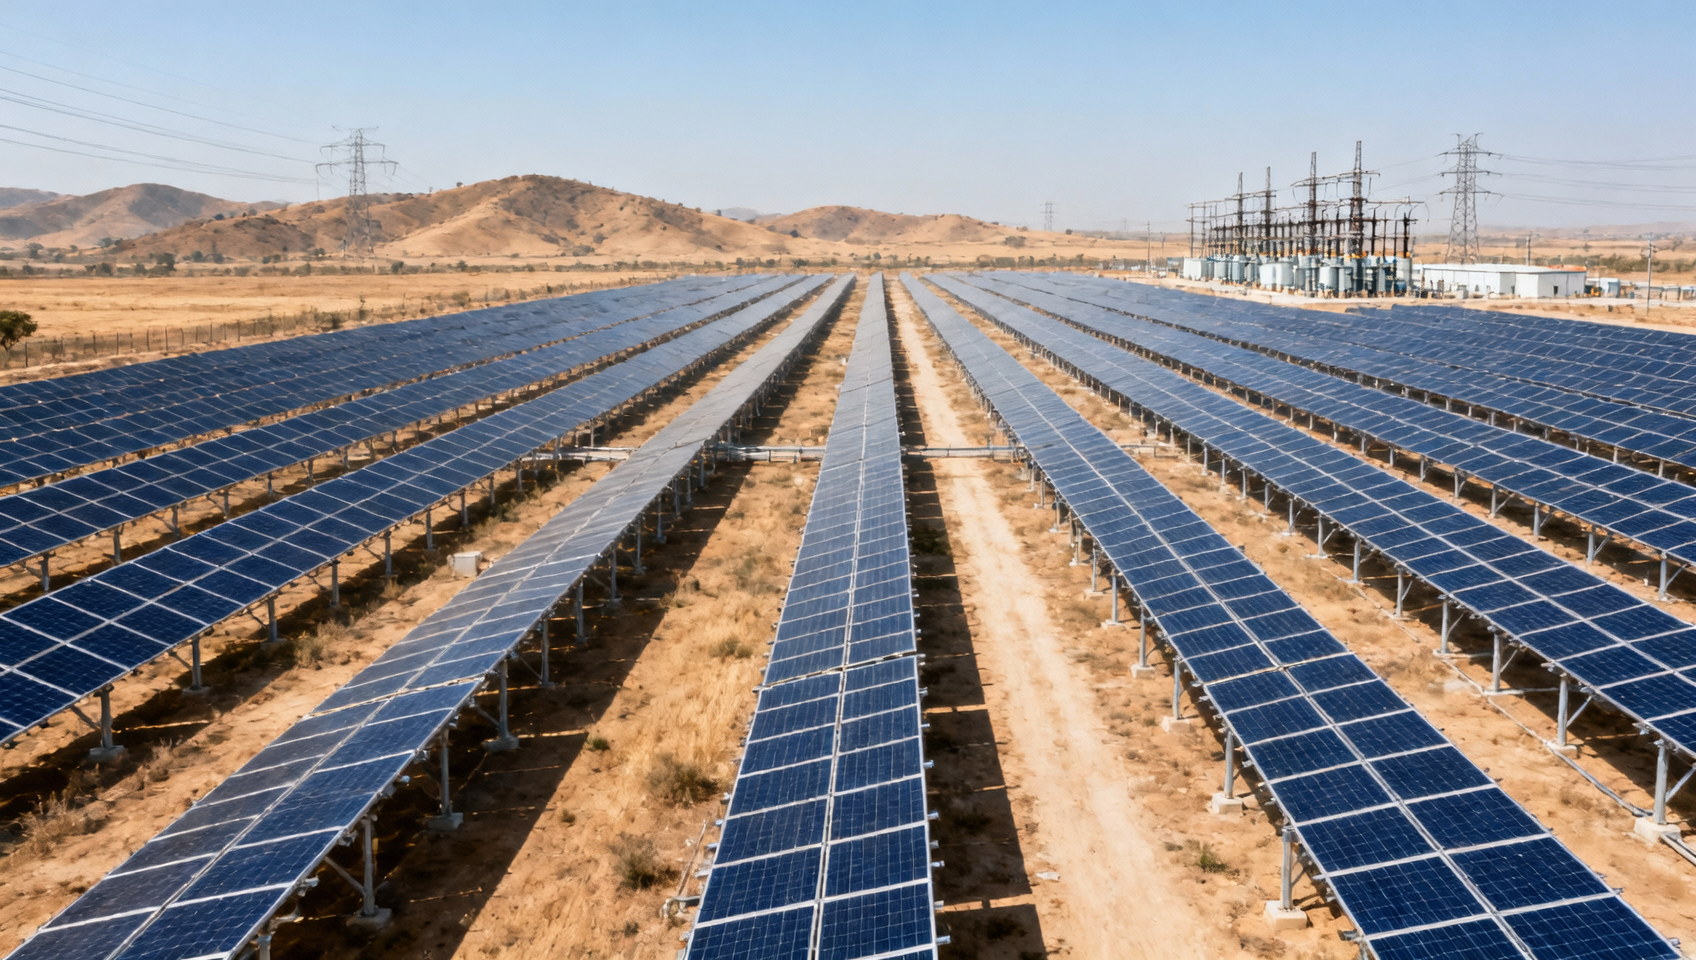
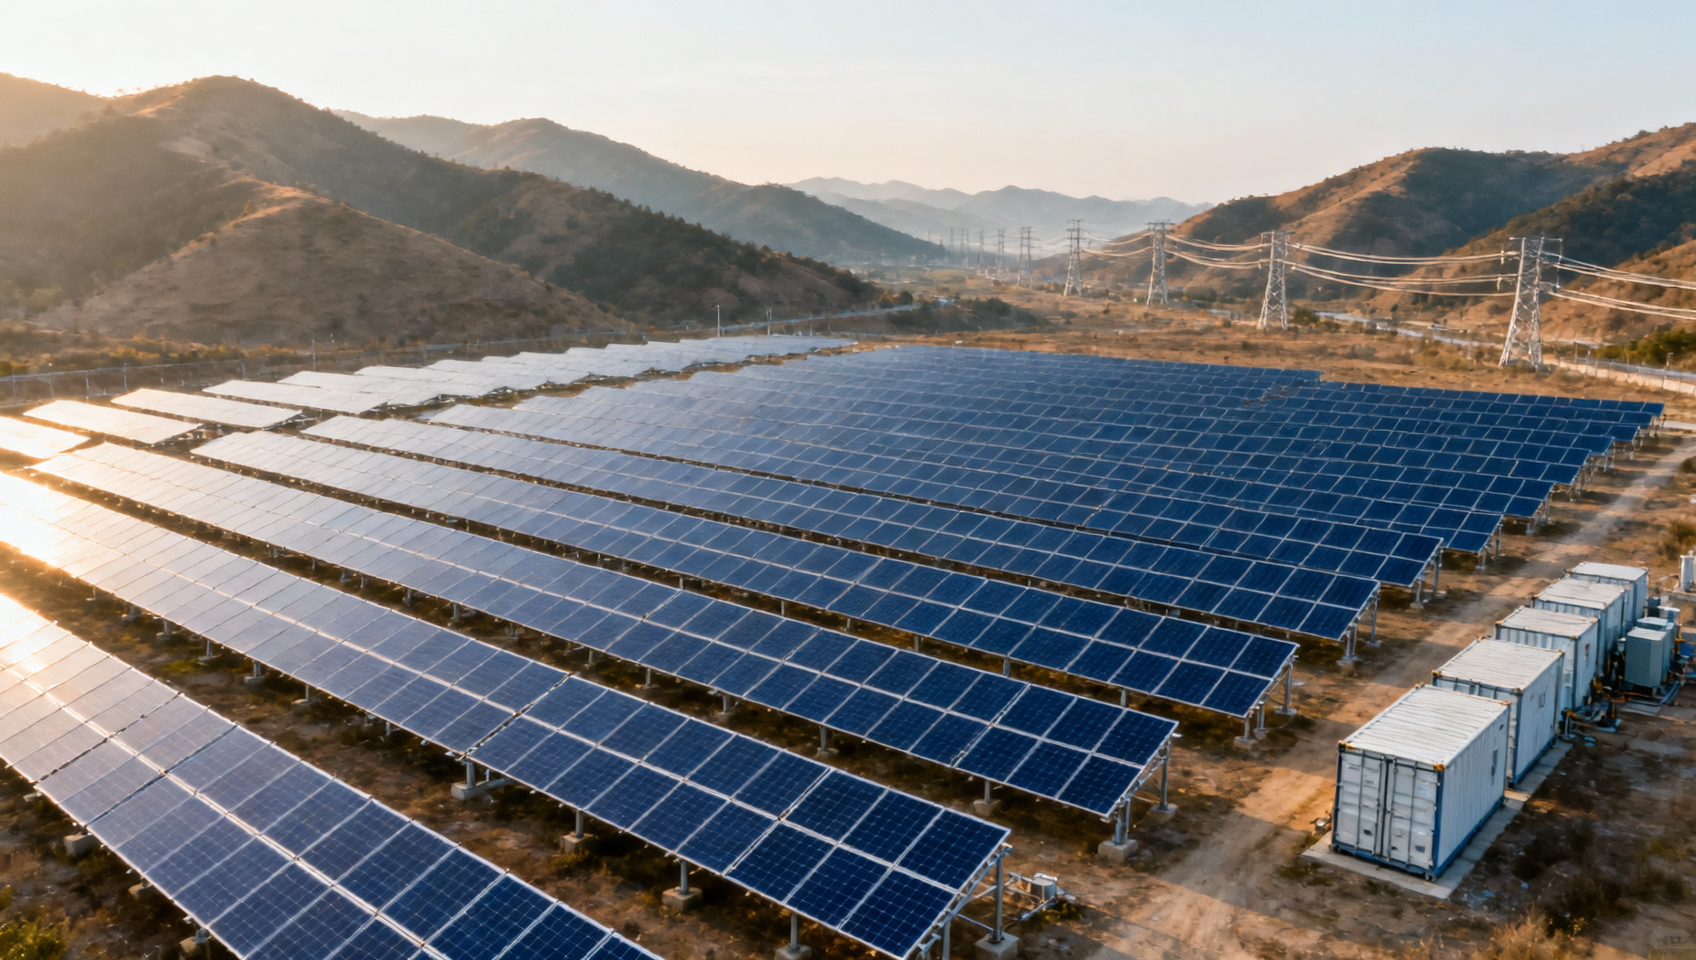
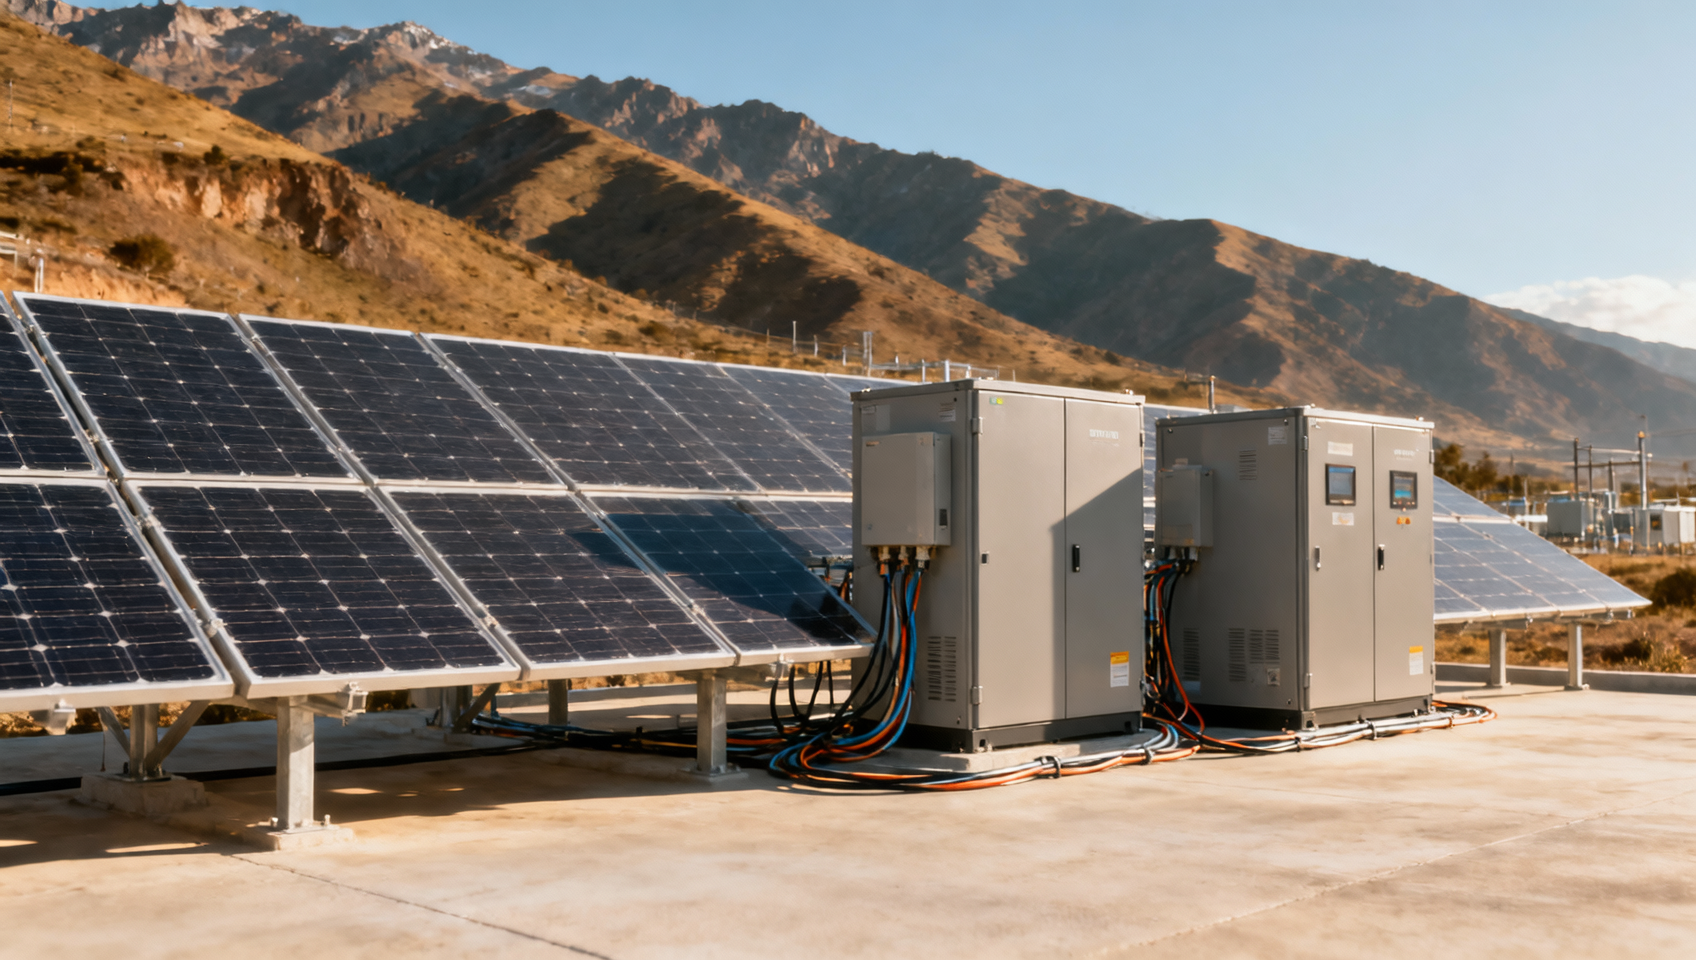
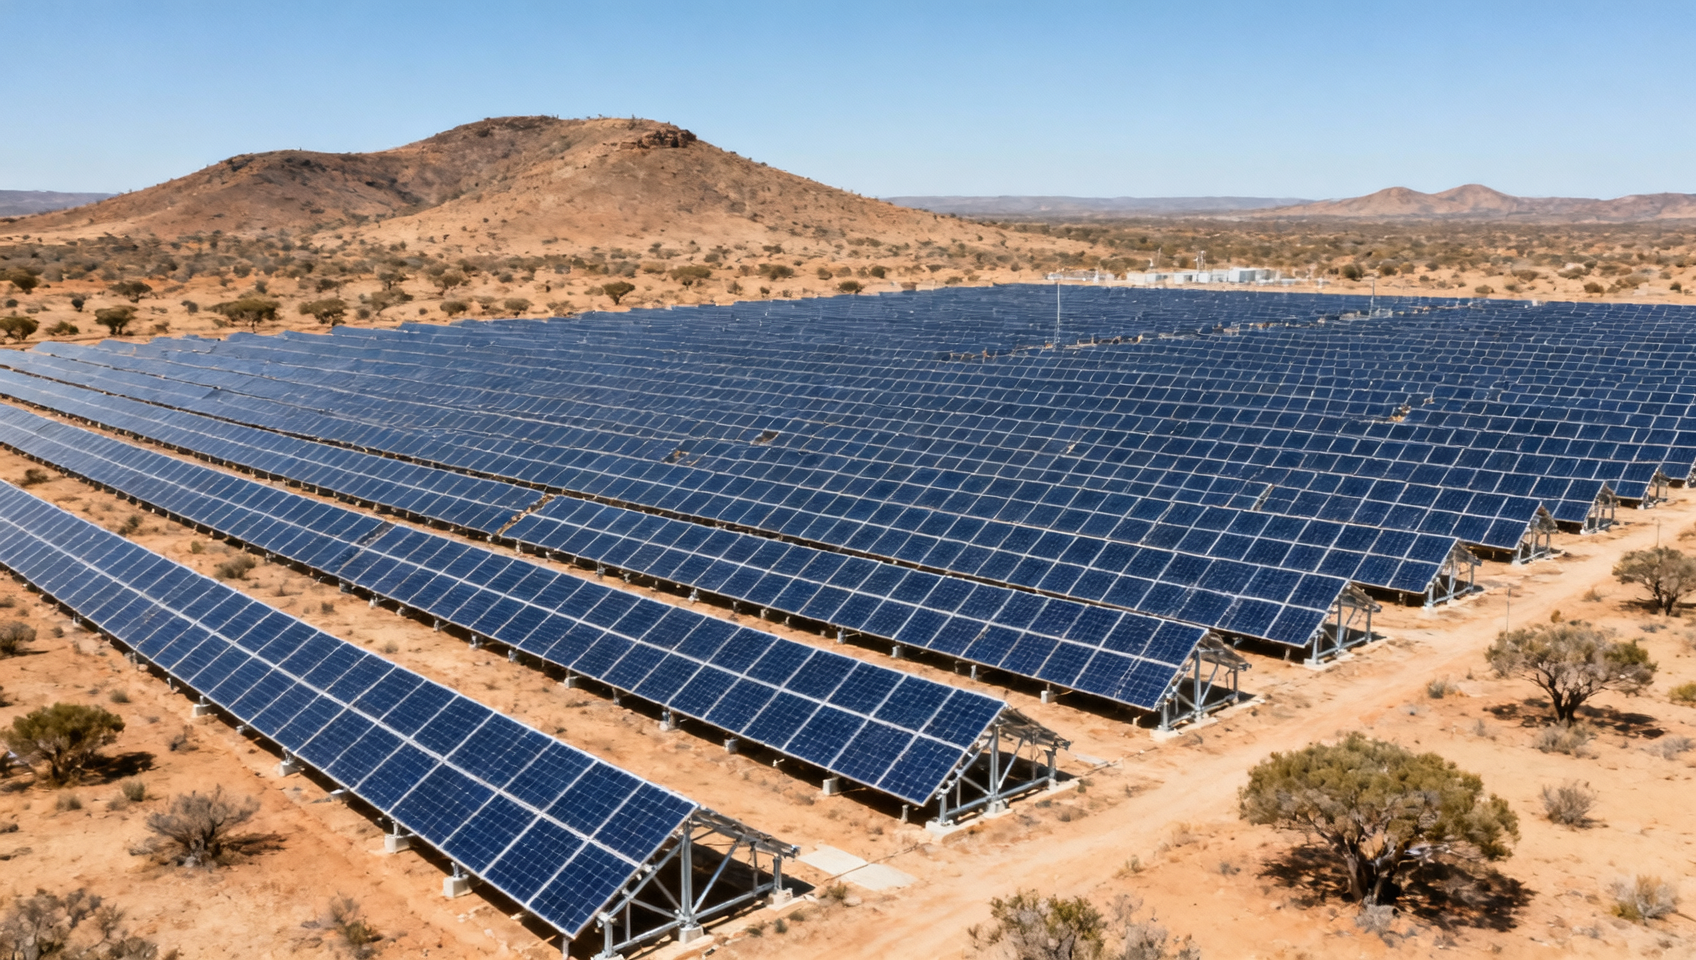
India added a record 8.4 GW of open-access solar capacity in the first nine months of 2026, an increase of 29% from the same period a year earlier, according to Mercom India’s report on the third quarter and first nine months of the year. Cumulative capacity reached 39.3 GW at the end of September, with Karnataka continuing to lead among states.
The figures show both the pace of recent additions and the size of the capacity already installed. The 8.4 GW added during the nine-month period is equivalent to roughly one-fifth of the cumulative total at the end of September. The two measures describe different things, however: the first tracks capacity added over a defined period, while the second represents the accumulated installed base.
What the increase shows
The 29% year-on-year rise indicates that additions during the first three quarters were higher than in the corresponding period of the previous year. Combined with the record cited in the report, it points to a particularly active period for India’s open-access solar market.
The figures do not, on their own, establish why additions increased or whether the same pace will continue. They also do not show how capacity was distributed across the individual quarters. Those distinctions matter when assessing whether the nine-month result reflects a sustained pattern or the timing of particular additions.
Karnataka’s continued lead is another feature of the reported market. Its position identifies the state as the leading location for cumulative open-access solar capacity, but the figures presented do not specify its share of the national total or how much it contributed to the nine-month increase. The national growth rate therefore should not be assumed to apply equally across states.
Where the effects may appear
For businesses involved in developing and supplying open-access solar projects, a larger volume of additions can translate into more activity across project delivery. Equipment procurement, construction and grid connection are among the stages that may be affected when capacity is brought online. The reported installation figures alone do not establish how much work reached each part of the supply chain or whether delivery conditions changed.
For electricity buyers considering open-access solar, the growing installed base may provide a broader set of operating projects to assess. The relevance to any individual buyer would still depend on the arrangements available to it and the conditions governing access and delivery. The national capacity total does not describe the terms, cost or performance of those arrangements.
Future market reports can help show whether additions remain at a similar level and whether growth becomes more broadly distributed across states. Changes in the balance between new capacity and the cumulative installed base would also help readers distinguish continued expansion from a single strong reporting period.
Get weekly intelligence in your inbox.
No noise. No sponsored content. Pure intelligence.
 Nov 22, 2026Golmud's 60 MW Liquid Air Storage Project Uses Fully Domestic EquipmentGolmud's 60 MW Liquid Air Storage Project Uses Fully Domestic Equipment
 Nov 22, 2026Precision Engineering for Medical Devices: Tolerances and MaterialsPrecision Engineering for Medical Devices: Tolerances and Materials
 Nov 21, 2026EDF Acquires 1GWh Holloway Battery Storage Project in AustraliaEDF Acquires 1GWh Holloway Battery Storage Project in Australia
 Nov 21, 2026Choosing Carbon Steel Grades for OEM Machined Parts: Key FactorsChoosing Carbon Steel Grades for OEM Machined Parts: Key Factors
 Nov 20, 2026China’s First Virtual Power Plant Report Says Capacity Target Met EarlyChina’s First Virtual Power Plant Report Says Capacity Target Met Early
 Nov 20, 2026Choosing an OEM Heavy Equipment Manufacturer: Capabilities and Quality ChecksChoosing an OEM Heavy Equipment Manufacturer: Capabilities and Quality Checks
 Nov 19, 2026India Adds Record 8.4 GW of Open-Access Solar in First Nine Months of 2026India Adds Record 8.4 GW of Open-Access Solar in First Nine Months of 2026
 Nov 19, 2026B2B Intelligence for Green Energy: Finding New Market OpportunitiesB2B Intelligence for Green Energy: Finding New Market Opportunities
 Nov 18, 2026Global Solar Additions Hit Record in 2025, Forecast to Fall in 2026Global Solar Additions Hit Record in 2025, Forecast to Fall in 2026
 Nov 18, 2026Supply Chain Visibility for Supplier Management: How to Spot Delivery RisksSupply Chain Visibility for Supplier Management: How to Spot Delivery Risks
 Nov 17, 2026US Battery Storage Deployment Tops 200 GWh; 74 GWh Forecast for 2026US Battery Storage Deployment Tops 200 GWh; 74 GWh Forecast for 2026
 Nov 17, 2026Choosing a Solar Tracker for Ground-Mount PV: Site and Design FactorsChoosing a Solar Tracker for Ground-Mount PV: Site and Design Factors
 Nov 16, 2026US Polysilicon and Solar Product Tariffs and Import Price Floor Take Effect December 4US Polysilicon and Solar Product Tariffs and Import Price Floor Take Effect December 4
 Nov 16, 2026How Industrial Buyers Can Evaluate B2B Intelligence Reports on SuppliersHow Industrial Buyers Can Evaluate B2B Intelligence Reports on Suppliers
 Nov 15, 2026CATL Sets Tener Sodium Delivery Timeline, Targeting LFP on CostCATL Sets Tener Sodium Delivery Timeline, Targeting LFP on Cost
 Nov 15, 2026Electric Wheelchairs for Disabled Adults: Choosing the Right Fit and RangeElectric Wheelchairs for Disabled Adults: Choosing the Right Fit and Range
 Nov 14, 2026China Expects Clean Energy to Meet All New Electricity Demand by 2030China Expects Clean Energy to Meet All New Electricity Demand by 2030
 Nov 14, 2026Choosing a Digital X-Ray Detector Supplier: Compatibility and SupportChoosing a Digital X-Ray Detector Supplier: Compatibility and Support
 Nov 13, 2026Ecuador Sets Zero VAT and Currency Outflow Tax Rates for Solar and Storage EquipmentEcuador Sets Zero VAT and Currency Outflow Tax Rates for Solar and Storage Equipment
 Nov 13, 2026Choosing an OEM Machined Parts Manufacturer: Quality, Capacity and Lead TimesChoosing an OEM Machined Parts Manufacturer: Quality, Capacity and Lead Times
 Nov 12, 2026South Africa Registers 2 GW of New Solar PV Capacity in Q3 2026South Africa Registers 2 GW of New Solar PV Capacity in Q3 2026
 Nov 12, 2026Mexico Supply Chain Market Research: Nearshoring Opportunities and RisksMexico Supply Chain Market Research: Nearshoring Opportunities and Risks
 Nov 11, 2026US Senate Advances Bipartisan BAAJA Energy Permitting BillUS Senate Advances Bipartisan BAAJA Energy Permitting Bill
 Nov 11, 2026Inventory Management Decision Support: When and How Much to ReorderInventory Management Decision Support: When and How Much to Reorder
 Nov 10, 2026China's Trade Surplus Tops $1 Trillion Through October as Exports Rise 35.2%China's Trade Surplus Tops $1 Trillion Through October as Exports Rise 35.2%
 Nov 10, 2026Choosing Surgical PPE: Gowns, Gloves, Masks and Eye ProtectionChoosing Surgical PPE: Gowns, Gloves, Masks and Eye Protection
 Nov 09, 2026US Solar Imports Shift as Domestic Manufacturing Investment Reshapes Global TradeUS Solar Imports Shift as Domestic Manufacturing Investment Reshapes Global Trade