How production volume affects ROI on an automated painting line
How production volume affects ROI on an automated painting line
An automated painting line can reduce labor costs and coating waste, but those savings only justify the investment when production demand supports sufficient utilization. Evaluating automated painting line ROI means looking beyond rated throughput to realistic output, product mix, changeover losses, and total operating costs. Higher volumes can spread fixed costs across more finished parts, while inconsistent demand can extend payback periods.
The central question is not how many parts the equipment can paint. It is how many acceptable parts the business can consistently produce and sell, at a cost advantage large enough to recover the installed investment. That distinction separates a credible capital request from a capacity forecast dressed up as a financial model.
Start with demand-backed output, not conveyor speed
Supplier quotations may express capacity as parts per hour, conveyor speed, or hanger positions. None of these measures automatically translates into saleable annual output. Part spacing, loading arrangements, coating requirements, curing time, and inspection criteria all affect the number of finished components leaving the line.
For a defensible estimate, build output from scheduled operating hours and a demonstrated rate for representative parts. Deduct planned changeovers and maintenance, then account for breakdowns, reduced-speed running, and quality losses. If an overall equipment effectiveness calculation already includes availability, performance, and quality, do not deduct those losses a second time.
Next, cap the financial benefit at demand the business can reasonably support. Spare capacity is not a saving. A line capable of replacing outsourced coating creates value only when the relevant work actually moves in-house. Likewise, extra production capacity generates incremental profit only if customers buy the additional output and the rest of the factory can supply it.
Check the entire process: pretreatment, drying, application, curing, unloading, and inspection. Faster spray equipment will not increase plant output if the curing oven or manual loading station remains the bottleneck. Capacity claims should therefore describe a complete operating configuration, not an isolated machine.
Why volume changes the economics
An automated line introduces costs that remain payable even during quiet weeks: maintenance contracts, software support, minimum staffing, and some facility expenses. Other costs follow operating hours or batch frequency rather than individual parts. Oven warm-up, booth ventilation, cleaning, and color changes can make short production runs expensive.
As output increases, these costs are distributed across more acceptable parts. But the relationship is not indefinitely linear. Adding a shift can trigger another supervisor, maintenance coverage, overtime premiums, or additional material-handling equipment. At higher loading, unplanned downtime may also become more costly because there is less spare time to recover missed production.
This means two plants with identical annual volumes can have different returns. One runs repeat parts in stable batches; the other processes many geometries and colors in small orders. The second plant may spend more time changing recipes, fixtures, and coatings, leaving fewer productive hours despite similar shipment totals.
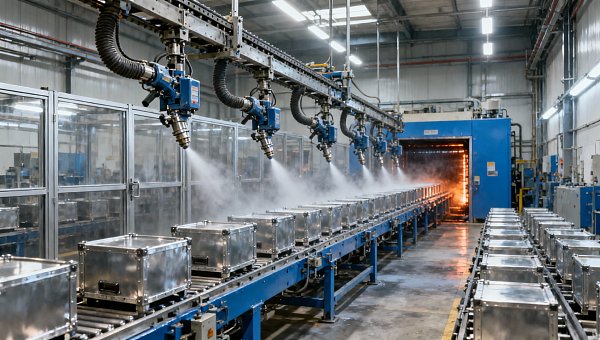
Volume should therefore be grouped by part family and production route. A large enclosure and a small bracket are not equivalent units. Coated surface area, fixture occupancy, required film thickness, and process time provide useful context when a simple part count would conceal the workload.
Calculate the threshold before discussing payback
A useful starting model compares the proposed line with the current process at the same acceptable output. Define annual output as Q, the net variable cash saving per acceptable part as S, and the additional annual fixed cash operating cost as F.
Annual operating cash benefit = (Q × S) − F
Under these simplified assumptions, operating cash break-even occurs at F ÷ S, provided S is positive. This threshold only covers incremental operating costs. It does not recover the initial investment or satisfy the company’s required return.
If installed investment is I and the target simple payback period is T years, an initial screening threshold is:
Required annual output for target payback = (F + I ÷ T) ÷ S
This calculation assumes stable annual savings, constant product mix, and no ramp-up delay. It excludes discounting, taxes, working-capital changes, residual value, and later capital spending. Use it to expose weak assumptions, not as the final approval model. Where savings or staffing change at different volume levels, calculate each operating range separately.
Simple payback is also not the same as ROI. It measures recovery time rather than total profitability. A fuller assessment should use annual incremental cash flows, net present value, and, where useful, internal rate of return. Apply the company’s hurdle rate and make the chosen project life explicit.
Make the savings auditable
The most vulnerable input is often the saving per part. Automation can reduce direct application labor, but loading, masking, unloading, inspection, and touch-up may remain manual. Labor productivity improves cash flow only when it avoids overtime, agency spending, recruitment, or another identifiable expense. Redeploying employees may be useful, but it is not automatically a payroll reduction.
Coating savings also need process-specific evidence. Application consistency and transfer efficiency depend on part geometry, equipment settings, coating chemistry, grounding where relevant, and maintenance condition. Powder recovery depends on the system configuration and color strategy; it should not be assumed for every installation. Compare material consumption per accepted part at the required coverage and film thickness, rather than comparing paint purchases alone.
Quality benefits deserve the same discipline. Reduced rework may save coating, energy, handling, and inspection time. However, a model that already includes those costs in the current cost per acceptable part must not add them again as separate benefits. Count avoided scrap using the actual cost incurred before rejection, not automatically the finished product’s selling price.
For additional sales, use incremental contribution after the costs needed to fulfill those orders. Do not treat incremental revenue as profit. Evidence of customer demand matters more than an optimistic market-growth assumption.
Include the costs outside the equipment quotation
Purchase price is only part of installed investment. Depending on project scope, the approval budget may need building modifications, ventilation, utility connections, fire protection, pretreatment equipment, wastewater handling, fixtures, integration, training, commissioning, freight, and applicable import costs. Local environmental and safety obligations require project-specific verification.
The transition can be expensive too. Production may need temporary outsourcing or parallel operation while recipes and staffing stabilize. Working capital can rise if the new line encourages larger coating batches and more work-in-process inventory. Include these effects in the timing of cash flows rather than burying them in a general contingency.
For cross-border purchases, clarify who supplies installation labor, local engineering, spare parts, and commissioning support. A lower equipment price can lose its advantage if service delays keep the line idle. Warranty scope, response arrangements, and acceptance conditions are financial inputs, not merely procurement paperwork.
Stress-test the production plan
A single annual forecast hides too much. Build downside, base, and upside cases using monthly demand, expected product mix, and realistic commissioning progress. Change the assumptions that actually interact: lower volume may mean smaller batches, while a broader color range may increase cleaning losses and material consumption.
Monthly modeling also reveals seasonality. A business can have enough annual demand on paper but insufficient capacity during peak months and substantial idle time afterward. Producing ahead may solve the scheduling problem, but inventory financing, storage, and potential obsolescence then belong in the investment case.
Approve the right scale, with evidence attached
When stable demand comfortably supports the required output threshold, a fully automated line may be justified. Where volume is uncertain or product variety is high, compare it with selective automation, a smaller modular installation, improvements to the existing process, or continued outsourcing. These alternatives should face the same quality requirements and cost boundaries.
Request trials using representative parts, including difficult geometries and realistic changeovers. Acceptance criteria should cover sustained acceptable throughput, coating quality, staffing needs, utility consumption under defined conditions, and changeover performance. A successful demonstration on an easy part is not enough to validate the annual business case.
TradeNexus Pro – Global B2B Intelligence, operating through chinaspecialmetal.com, approaches advanced manufacturing decisions through market intelligence and supplier analysis rather than equipment listings alone. That perspective is useful here: technical capability, demand reliability, supplier support, and installed cost need to be evaluated together.
Before approval, reconcile the volume forecast with customer demand, the savings model with existing production records, and the equipment proposal with trial evidence. If the investment only meets its return target at near-perfect utilization, reconsider the configuration. The stronger project is the one whose required output remains achievable after allowing for real production losses and a credible downside case.
Get weekly intelligence in your inbox.
No noise. No sponsored content. Pure intelligence.
 Oct 22, 2026Mitsubishi Electric Develops Industry-First Humanoid Robot–CNC Machining SystemMitsubishi Electric Develops Industry-First Humanoid Robot–CNC Machining System
 Oct 22, 2026Aerospace Aluminum Machining: How to Control Distortion in Thin-Wall PartsAerospace Aluminum Machining: How to Control Distortion in Thin-Wall Parts
 Oct 21, 2026Genesis Energy commissions 200 MWh battery storage system at HuntlyGenesis Energy commissions 200 MWh battery storage system at Huntly
 Oct 21, 2026Buying AMI Smart Meters Wholesale: Compatibility Checks and Total CostsBuying AMI Smart Meters Wholesale: Compatibility Checks and Total Costs
 Oct 20, 2026Werner Enterprises Issues Q3 Earnings Warning as Costs RiseWerner Enterprises Issues Q3 Earnings Warning as Costs Rise
 Oct 20, 2026Are Digital Twins Viable for SMEs? Costs, Use Cases, and Data RequirementsAre Digital Twins Viable for SMEs? Costs, Use Cases, and Data Requirements
 Oct 19, 2026Choosing a Wholesale Servo Motor Exporter: Traceability and Warranty ChecksChoosing a Wholesale Servo Motor Exporter: Traceability and Warranty Checks
 Oct 18, 2026Syringe Manufacturing Equipment: Evaluating Throughput and Assembly AccuracySyringe Manufacturing Equipment: Evaluating Throughput and Assembly Accuracy
 Oct 17, 2026Air Freight Forwarding Services: How to Compare Quotes for Urgent ShipmentsAir Freight Forwarding Services: How to Compare Quotes for Urgent Shipments
 Oct 16, 2026Wholesale Solar Panels: How to Compare Bulk Quotes by Total Landed CostWholesale Solar Panels: How to Compare Bulk Quotes by Total Landed Cost
 Oct 15, 2026Supply Chain Intelligence for Sourcing: How to Vet New SuppliersSupply Chain Intelligence for Sourcing: How to Vet New Suppliers
 Oct 14, 2026How skills shortages slow smart manufacturing in Southeast AsiaHow skills shortages slow smart manufacturing in Southeast Asia
 Oct 14, 2026How CNC wire-cut machining maintains tight tolerances in thick partsHow CNC wire-cut machining maintains tight tolerances in thick parts
 Oct 14, 2026Can automated feeding stabilize metal forming in smart factories?Can automated feeding stabilize metal forming in smart factories?
 Oct 14, 2026Can CT inspection detect internal defects in metal additive parts?Can CT inspection detect internal defects in metal additive parts?
 Oct 14, 2026When does additive manufacturing reduce lead time for spare parts?When does additive manufacturing reduce lead time for spare parts?
 Oct 14, 2026How production volume affects ROI on an automated painting lineHow production volume affects ROI on an automated painting line
 Oct 14, 2026What data does manufacturing bottleneck analysis consulting need?What data does manufacturing bottleneck analysis consulting need?
 Oct 14, 2026When should you hire a consultant for manufacturing bottlenecks?When should you hire a consultant for manufacturing bottlenecks?
 Oct 14, 2026How Do You Measure AI Adoption Maturity in a Traditional Factory?How Do You Measure AI Adoption Maturity in a Traditional Factory?
 Oct 14, 2026Are Chinese AI-Assisted Surgical Devices Gaining Global Trust?Are Chinese AI-Assisted Surgical Devices Gaining Global Trust?
 Oct 14, 2026What Happens When Warehouse Robots Need Software Updates Mid-Operation?What Happens When Warehouse Robots Need Software Updates Mid-Operation?
 Oct 14, 2026How Do Plants Calculate Real Savings from Energy-Efficient Equipment?How Do Plants Calculate Real Savings from Energy-Efficient Equipment?
 Oct 14, 2026Are Digital Twins Only for Large Enterprises, or Can SMEs Use Them?Are Digital Twins Only for Large Enterprises, or Can SMEs Use Them?
 Oct 14, 2026What Are the Common Failure Modes in Legacy Industrial Control Systems?What Are the Common Failure Modes in Legacy Industrial Control Systems?
 Oct 14, 2026Do Electronic Component Distributors Add Value or Just Markup?Do Electronic Component Distributors Add Value or Just Markup?
 Oct 14, 2026What ESG Requirements Apply to Solar PV Exporters Selling to Europe?What ESG Requirements Apply to Solar PV Exporters Selling to Europe?